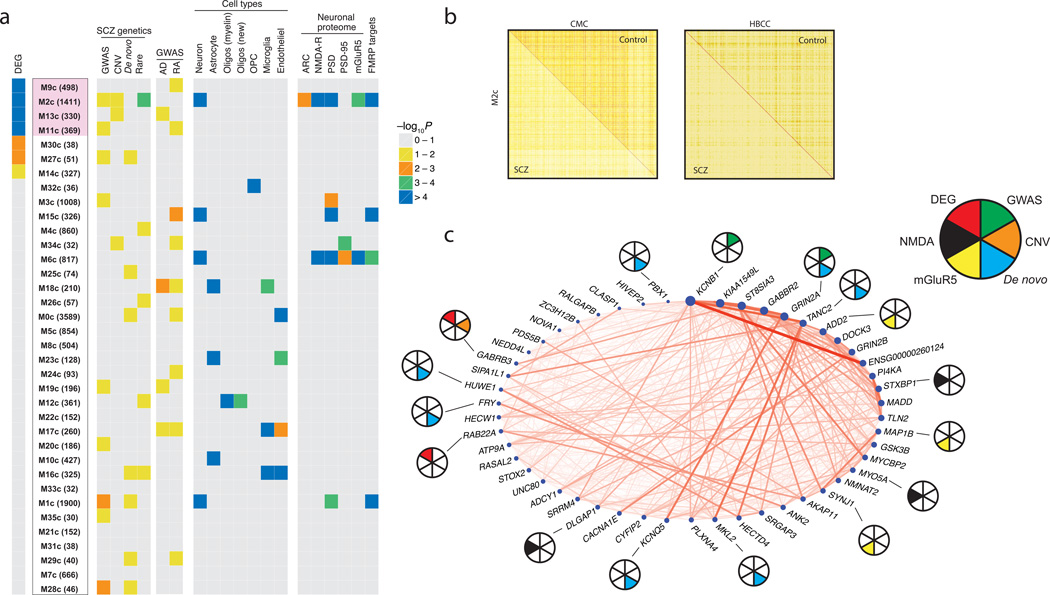
Figure 6. Co-expression network analysis in control DLPFC samples.
(a) Control-derived modules were ranked by enrichment [estimated based on Fisher’s exact test (FET)] with differentially expressed genes; number of genes in each module is given in parentheses. Among the 4 modules with strongest overlap (marked in blue), only the M2c module genes are strongly enriched for multiples lines of prior genetic evidence: differential expression (FET: OR = 2.3, Bonferroni adjusted P = 1.9 × 10⁻¹²), SCZ GWAS loci (tested by INRICH: FE [fold-enrichment] = 1.36, P = 0.04), rare CNV (tested by INRICH: FE = 1.52, P = 0.051), and rare nonsynonymous variants (tested by PLINK/Seq and SMP: FE = 1.18, P = 2 × 10⁻⁴). The enrichment of each module with SCZ genetics, cell type-specific markers, neuronal proteome sets (proteins that are localized to the postsynaptic density of neurons), and fragile X mental retardation protein (FMRP) targets is depicted at right. As a control, note the lack of enrichment of M2c with common variants for Alzheimer’s disease (AD) and rheumatoid arthritis (RA). (b) Topological overlap matrix of the differentially connected M2c module in controls (upper right triangle) and SCZ cases (lower left triangle) in the CMC (left) and HBCC (right) cohorts. (c) Circle plot showing connection strengths for the top 50 hub genes of the M2c module, where node size corresponds to intramodular connectivity and nodes are ordered clockwise based on connectivity. Pie chart: SCZ susceptibility genes based on GWAS PGC2-SCZ (green), CNV (orange) or de novo (cyan) studies; Genes that belong in the NMDA (black) or mGluR5 (yellow) signalling pathway; Genes that are differentially expressed in schizophrenia vs. controls at FDR ≤ 5% (red).

