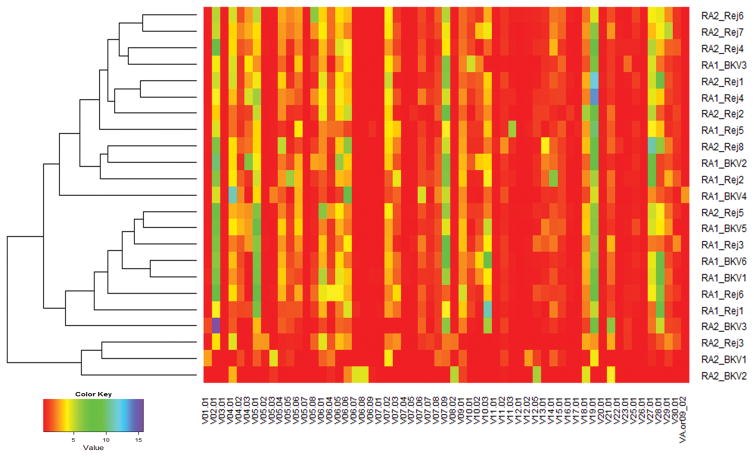
Fig. 2.
Dendrogram of V-family Utilization in RA1DA2 & RA2DA1 Biopsies with BKPyVM/BKPyVN (BKV) or T-cell mediated rejection (Rej). The X-axis lists all the 59 V-families evaluated. The individual biopsies on the Y-axis are designated as RA1 if they represent an HLA-A01+ patient with an HLA-A02+ graft or RA2 if they represent an HLA-A02+ patient with an HLA-A01+ graft. V-family usage in each sample is color coded from least abundant (red) to most abundant (purple). It can be appreciated that biopsy samples with rejection tend to cluster at the top portion of the diagram (9 of the first 11 rows), while those with viral infection tend to cluster in the lower half (6 of the last 11 rows), although the separation is not perfect.

