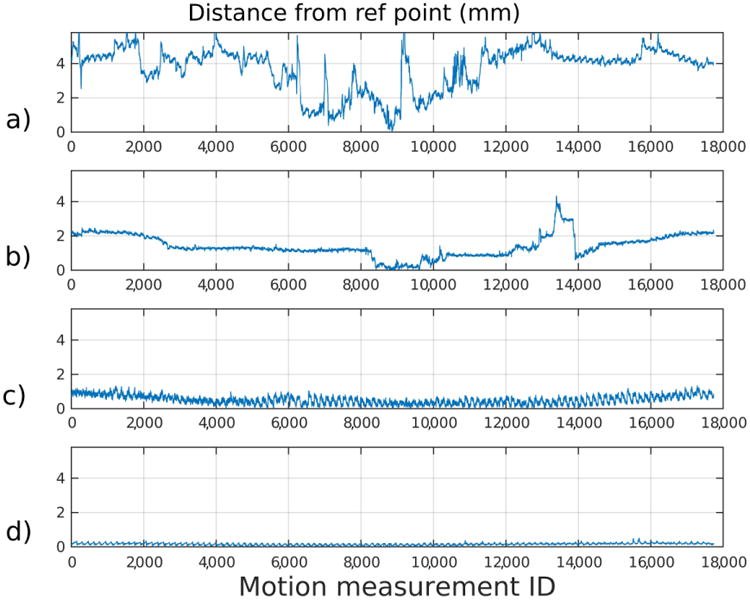
Fig. 2.

Sensor motion displayed in millimeters (mm) from the same children as shown in Fig. 1, ordered vertically according to image grade (a grade 1, b grade 2, c grade 3, d grade 4). The y-axis shows the sensor displacement from the reference position for the whole scan. The x-axis shows the time sample index. The motion shown in (a) resulted in a non-diagnostic image (in a 13-year-old boy), whereas the motion shown (d) resulted in an image evaluated as containing “no visible motion artifacts” (in a 17-year-old boy). Image grades corresponding to 2 and 3 were from 14-year old male and 16-year old female.
