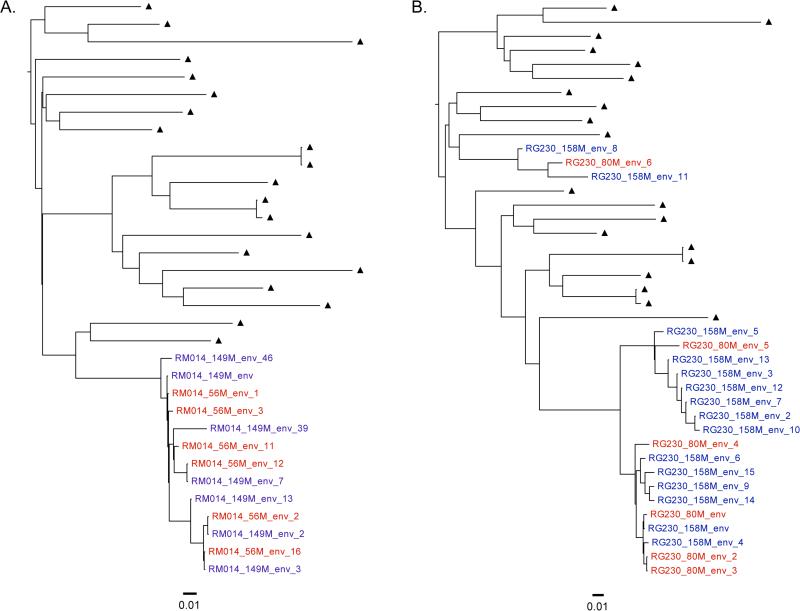
Figure 1. Representative phylogenetic trees illustrating HIV dual infection.
Shown are maximum likelihood phylogenetic trees of longitudinal env sequences from two participants representing: A) HIV monoinfection, and B) HIV dual infection. Viral sequence labels from the first timepoint are in red, and sequences from the second timepoint are in blue. Epidemiologically unrelated subtype B background viral sequences are shown as black triangles. Phylogenetic distance is shown at the bottom of each tree for reference.

