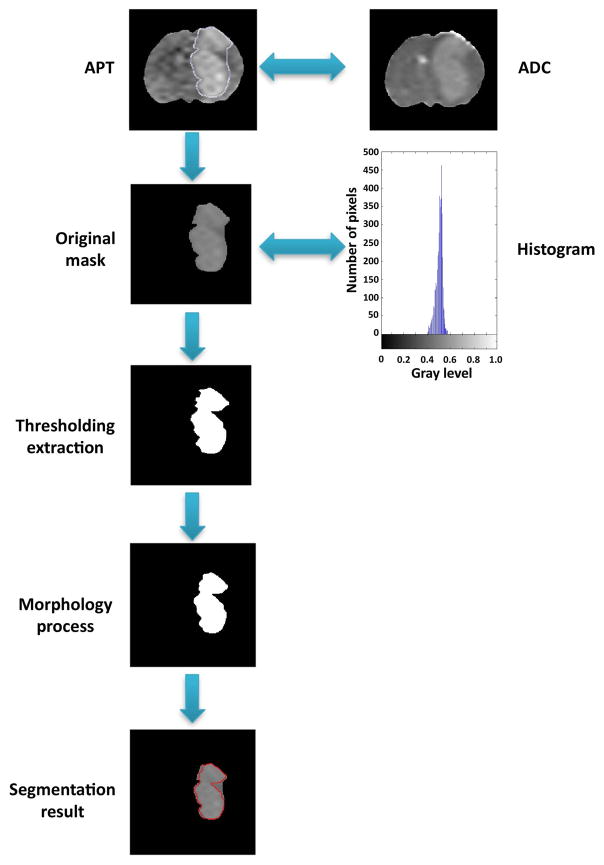
Fig. 1.
Flow-chart of the semi-automated tumor region extraction method for one sample. First, an initial ROI was extracted by the human interaction from an APTw map. If necessary, the information was co-registered to the ADC map. Second, the histogram was taken into consideration and the original mask was labeled. Next, the temporary result was de-noised by a morphologic process. Finally, the contour was highlighted.

