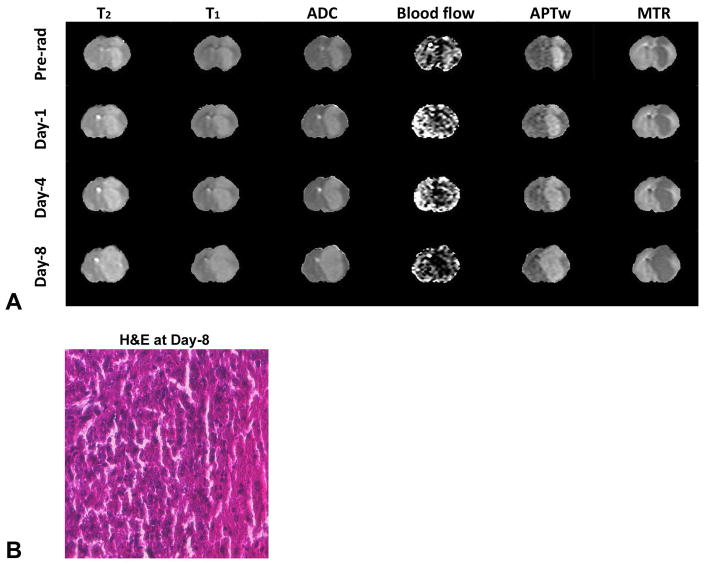
Fig. 4.
(A) Changes in T2 maps (0 – 100 ms), T1 maps (0.5 – 2 s), ADC maps (0 – 2 × 10⁻⁹ m2/s), blood flow maps (0 – 200 mL/100 g/min), APTw images (−10% to 10% of the bulk water signal intensity), and MTR maps at 2 kHz (0% – 50% of the bulk water signal intensity) at different time points of pre-radiation and on day 1, day 4, and day 8 post-radiation for one representative rat with a U87 MG glioma. The outside noise of brain tissue has been filtered out. (B) The H&E image at 8 days post-radiation, taken from the central part of the tumor.

