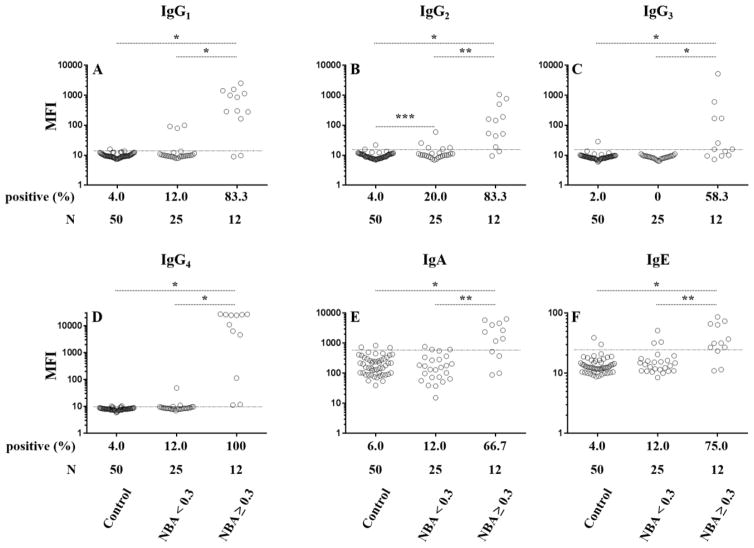
Figure 2. Fluorescence immunoassay results for anti-FIX antibodies in plasma from patients who have hemophilia B (HB) and healthy controls.
Data points represent results for individual plasma samples for IgG1 (A), IgG2 (B), IgG3 (C), IgG4 (D), IgA (E), and IgE (F). Results are displayed on a log scale for control plasmas from healthy donors and patients with hemophilia B who tested negative (< 0.3) or positive (≥ 0.3 NBU) by the Nijmegen-Bethesda assay. Thresholds for positivity, which, are set at two standard deviations above the mean MFI of control samples and represented by dashed lines are 13.6, 15.0, 15.4, 9.8, 600.5, and 24.6 for IgG1, IgG2, IgG3, IgG4, IgA, and IgE, respectively. * P ≤ 0.0001; **P ≤ 0.002; *** P = 0.0375

