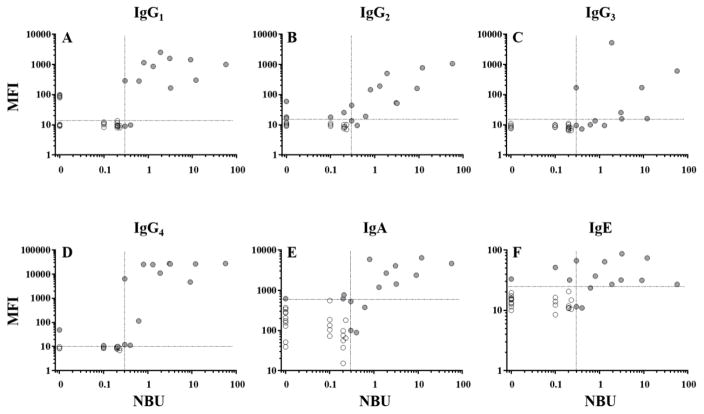
Figure 3. Correlation of anti-FIX fluorescence immunoassay and Nijmegen-Bethesda assay results for samples from patients with hemophilia B.
As shown, individual data points represent results obtained on hemophilia B patient samples using the immunoglobulin-specific FLIs (IgG1 (A), IgG2 (B), IgG3 (C), IgG4 (D), IgA (E), or IgE (F)) plotted on a log scale against NBA results for the same plasma sample. Samples positive for one or both assays (filled circles) were used to calculate linear correlations according to Spearman (r). Dashed lines represent the thresholds of positivity.

