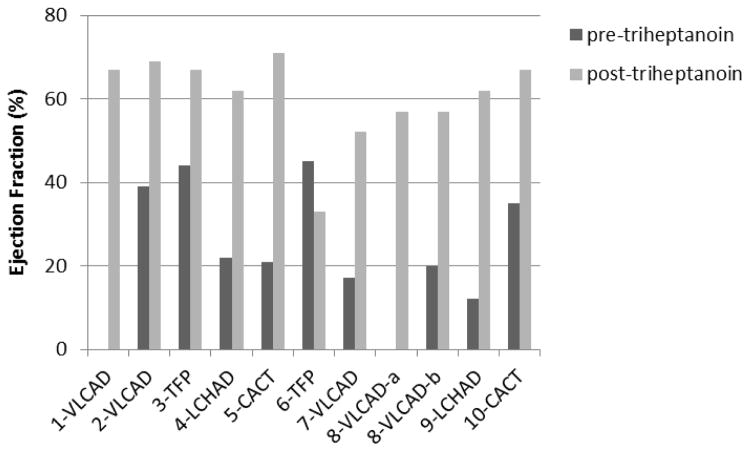
Figure 2. Peak Ejection Fraction Improvements Following Initiation of Triheptanoin.
Peak ejection fraction (EF) improvements following initiation of triheptanoin. Lines represent EF values prior to triheptanoin treatment (where available) and the peak EF achieved following initiation of triheptanoin for patients presented in Cases 1–10.

