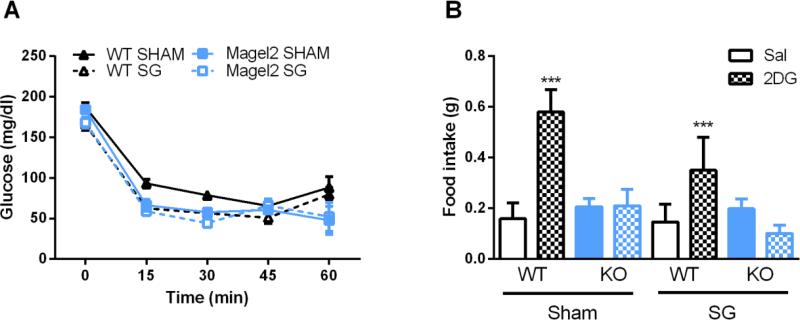
Figure 4.
Response to 2DG and insulin challenge.
(A) In response to insulin, circulating glucose levels drop more in Magel2 mice (main effect of genotype p < 0.01) and after SG (main effect of surgery p < 0.01). (B) 4 hours after injection, Magel2 mice fail to increase their feeding in response to 2DG, and look similar to saline injected Magel2 mice (genotype × drug effect, ***p < 0.001). Values graphed as mean ± SEM.

