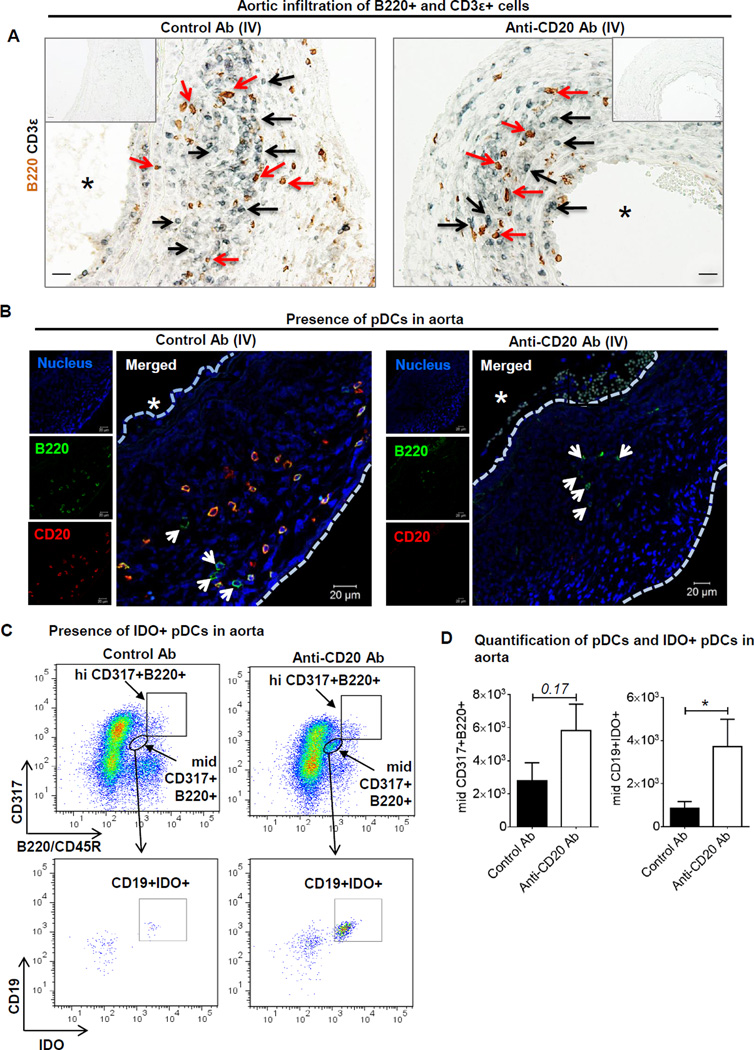
Figure 5. pDCs are present in mouse AAAs.
A, Representative images acquired on a light microscope showing AAA sections stained for B220+ (brown) cells and CD3ε+ (black) cells, scale bar 10 µm. Black arrows indicate CD3+ cells and red arrows B220+ cells. ‘*’ indicates lumen. B, Immunofluorescent images acquired on a confocal microscope showing colocalized B220 (green) and CD20 (red) staining indicating B cells, and only B220 staining indicating dendritic cells (indicated by arrows) in AAA of control or anti-CD20 antibody treated WT mice. ‘*’ indicates lumen and ‘----’ indicates luminal and exterior margins of aorta. C, Representative Flow cytometry plots showing gating and increase in concentration of mid B220+CD317+CD19+IDO in AAA following control or anti-CD20 antibody via IV. The cells have been gated for singlets, live, CD45+ and CD4× mononuclear cells. D, Quantification of total pDCs and IDO+ pDCs in aorta (n=3–5). Non-parametric t-test (Mann-Whitney test) was applied to determine significant differences between the groups. Values are expressed as means ± SEM, “*” indicates p<0.05. ‘p’ values >0.05 are indicated on the top of the bars.

