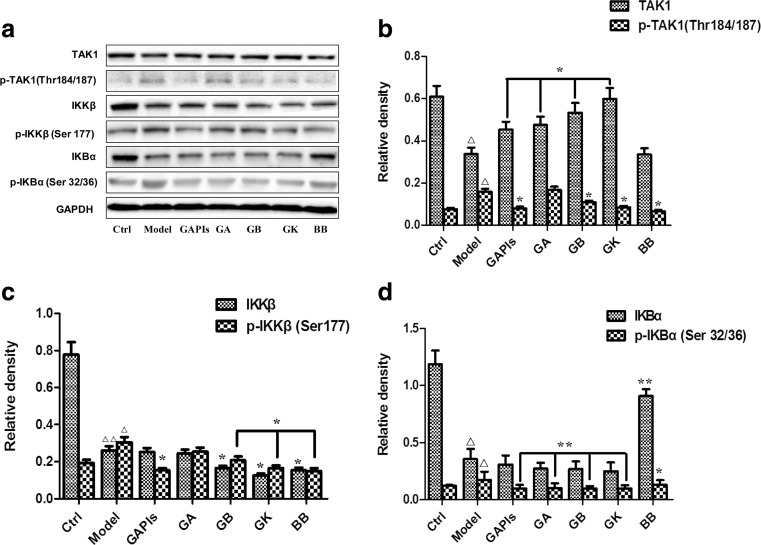
Fig. 6.
Effects of ginkgolides and bilobalide on the expression of p-TAK1, p-IKKβ and p-IkBα in BV2 microglia cells after OGD/R. After exposure to OGD for 4 h, BV2 cells were reoxygenated for either 1 h or 1 h followed by treatment with 50 μg/ml GAPIs, GA, GB, GK, and BB respectively. Representative graph a and quantitative data b p-TAK1, c p-IKKβ, and d p-IkBα levels in BV2 microglia cells. GAPDH was used as the loading control. Western blot images are representative of three independent experiments. Each data point is a mean ± SD (n = 3). △ P < 0.05, △△ P < 0.01, as compared with corresponding control group; * P < 0.05, ** P < 0.01, as compared with corresponding model group

