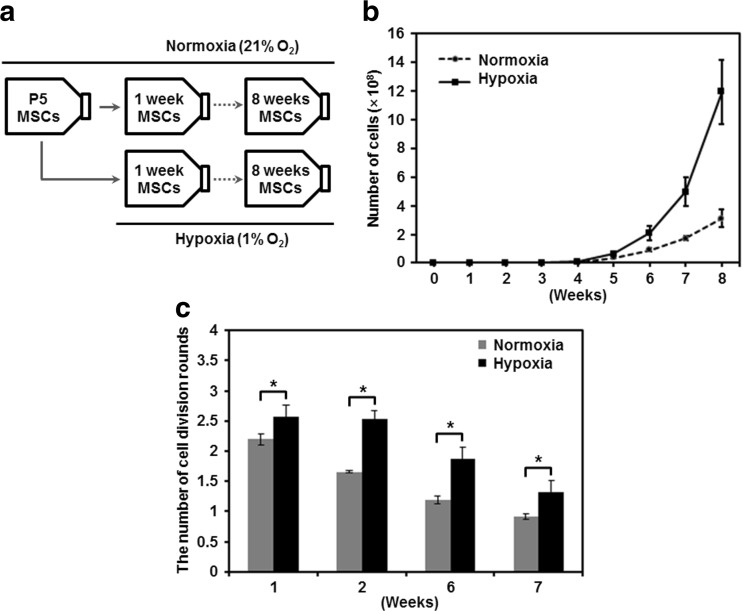
Fig. 4.
Proliferation rates of MSCs under hypoxia or normoxia during long-term cultivation. a Schematic drawing of a long-term MSC culture under different oxygen tensions. D1 MSCs at passage 5 were cultured and maintained under hypoxia or normoxia for 8 weeks (passage 13). b Long-term growth curve of MSCs cultured under hypoxia or normoxia. Cells were counted and passaged once per week, and cumulative cell numbers were determined for 8 weeks. Long-term growth curves represent four independent experiments performed at each oxygen concentration. c The number of cell divisions of MSCs cultured under hypoxia or normoxia. The number of cell divisions was calculated with respect to cell number. *P < 0.01

