Fig. 5.
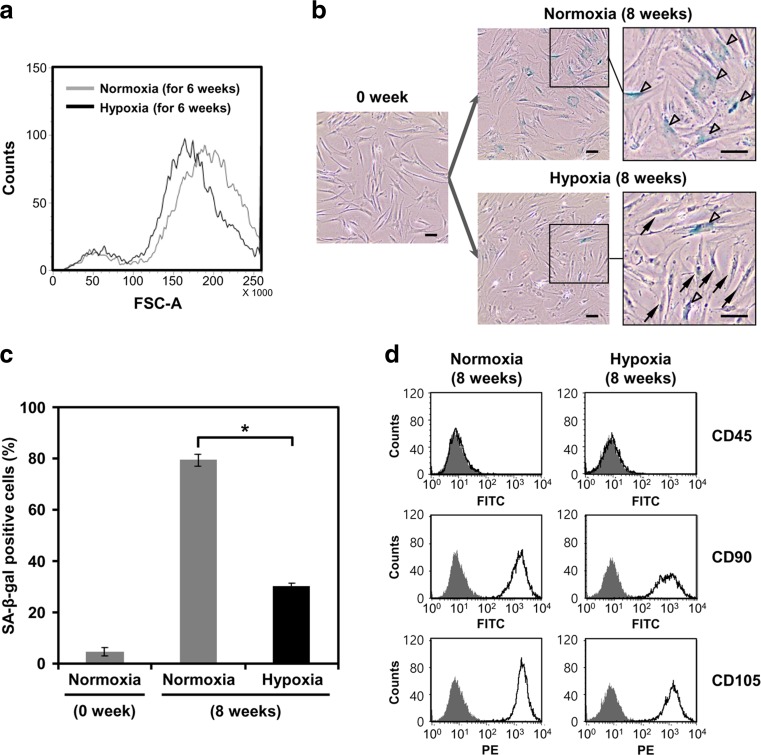
Phenotypic characteristics of MSCs under hypoxia or normoxia during long-term cultivation. a Change in cell size of MSCs under hypoxia or normoxia over time in culture. D1 MSCs at passage 5 were cultured under hypoxia or normoxia for 6 weeks. The size of MSCs was measured using flow cytometry and is reflected by the forward-scatter signal. b Morphology and senescence-associated β-galactosidase (SA-β-gal) staining of MSCs cultured under hypoxia or normoxia for 8 weeks. Blank arrow head indicates SA-β-gal-positive cell and black arrow indicates SA-β-gal-negative cell that grows in culture with a spindle-shaped morphology. Scale bar at 100 μm. c Percentage of SA-β-gal-positive cells was counted in three independent experiments. *P < 0.01. d Flow cytometric analysis of surface markers of MSCs cultured under hypoxia or normoxia for 8 weeks. All MSCs cultured under hypoxia or normoxia were negative for FITC-conjugated CD45 and positive for FITC-conjugated CD90 and PE-conjugated CD105

