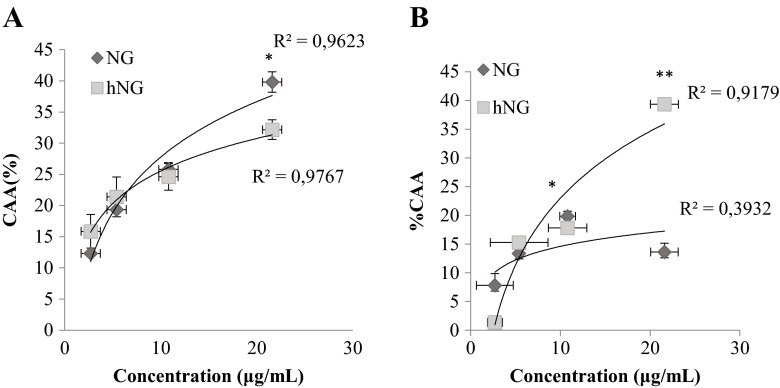
Fig. 5.
Dose-response curve for oxidation of DCFH to DCF in macrophages (a) and splenocytes (b) using a cellular antioxidant activity assay in the presence of native naringenin (NG) and heated naringenin (hNG). The curves shown in each graph are from a single experiment (mean ± SD, n = 3). *p < 0.05, value significantly different from molecularly treated cells. **p< 0.01

