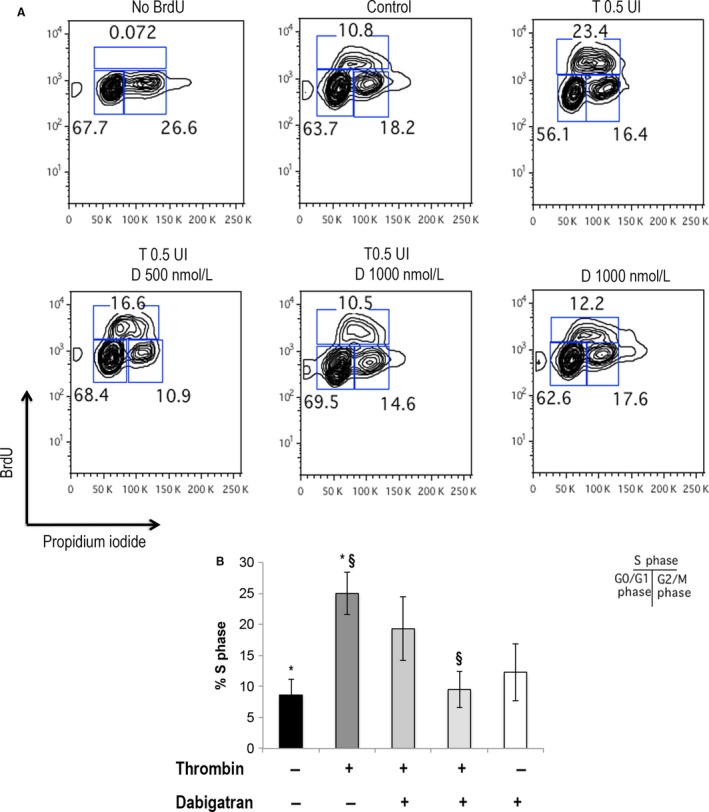
Figure 4.

Cell cycle analysis of MDA‐MB231cells by BrdU. Panel A: MDA‐MB231cells were treated with thrombin, thrombin and dabigatran or dabigatran for 24 h and pulsed with BrdU for 1 h followed by staining with anti‐BrdU FITC and PI. BrdU‐labeled G0/G1, S, and G2/M populations are shown. Panel B: histograms of cells at S phase for each different treatment. *P < 0.05 control versus thrombin; § P < 0.05 thrombin versus thrombin/dabigatran.
