
Figure 6.
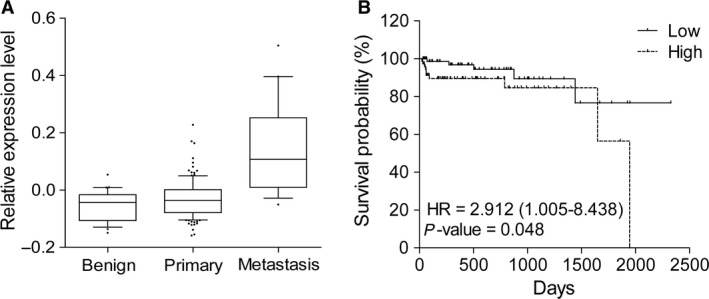
Clinical relevance of E2F8 in prostate cancer patients. (A) The expression levels of E2F8 in prostate cancer patient samples (GSE21034 and GSE3325) were represented in the box‐plot. The x‐axis indicates three different stages of prostate cancer and y‐axis represents the normalized expression level of E2F8. (B) Survival curve for prostate cancer patients (ICGC dataset) based on the expression levels of E2F8. HR, hazard ratio (95% confidence interval).