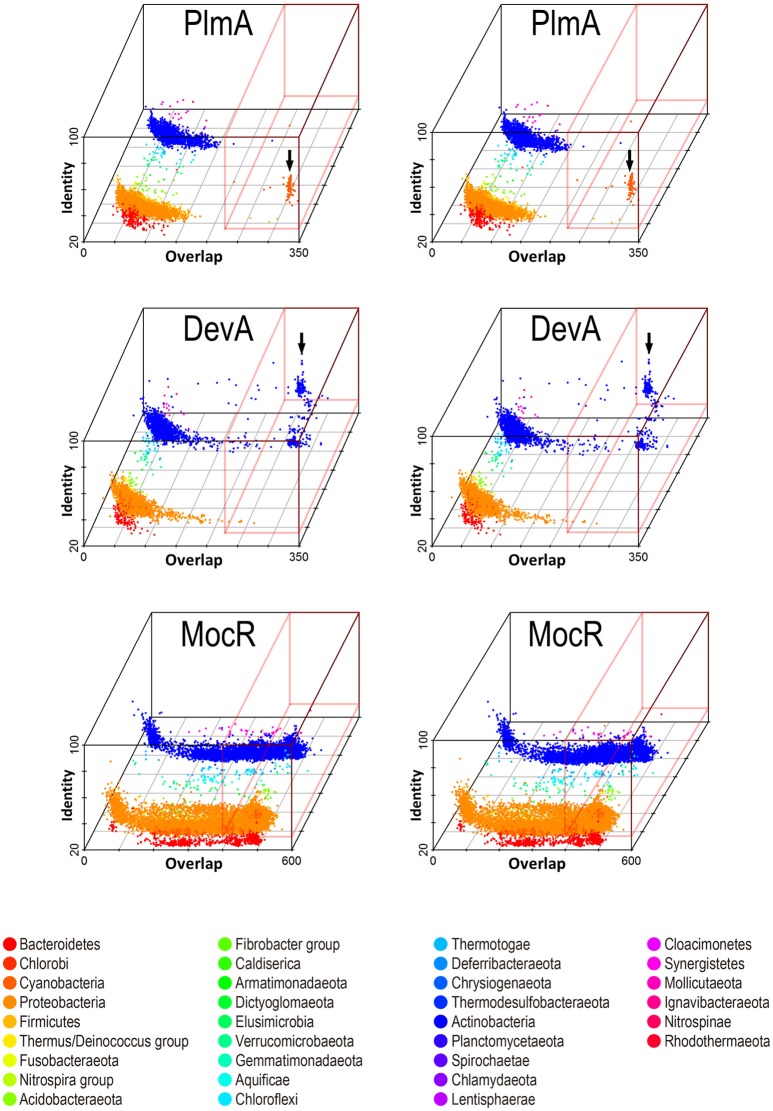
Figure 5.
Stereo view allowing 3D visualization of the phylogenetic distribution of members of GntR subfamilies PlmA, DevA, and MocR. Representative sequences of each subfamily were used as queries in bidirectional blast searches against the Refseq bacterial database (see Methods). The overlap and identity of the hits (relative to the bait sequence) are shown with a color-code and separated by a third axis according to taxonomy (phylum level). Hits with high overlap and identity are in a red box and arrows point to cyanobacteria and actinobacteria for PlmA and DevA, respectively.

