
Figure 2.
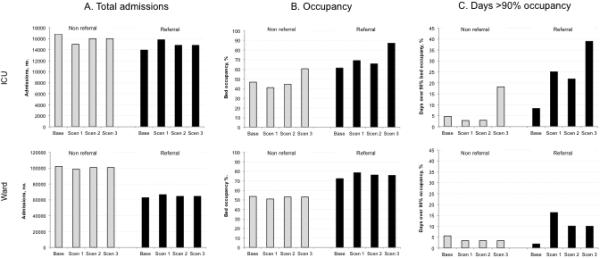
Outcomes for each of four simulation scenarios, including total admissions (Fig 2A), mean daily bed occupancy (Fig 2B), and proportion of days over 90% bed occupied (Fig 2C). Grey bars represent non-referral hospitals, black bars represent referral hospitals. ICU data shown in top row and Ward data shown in lower row.