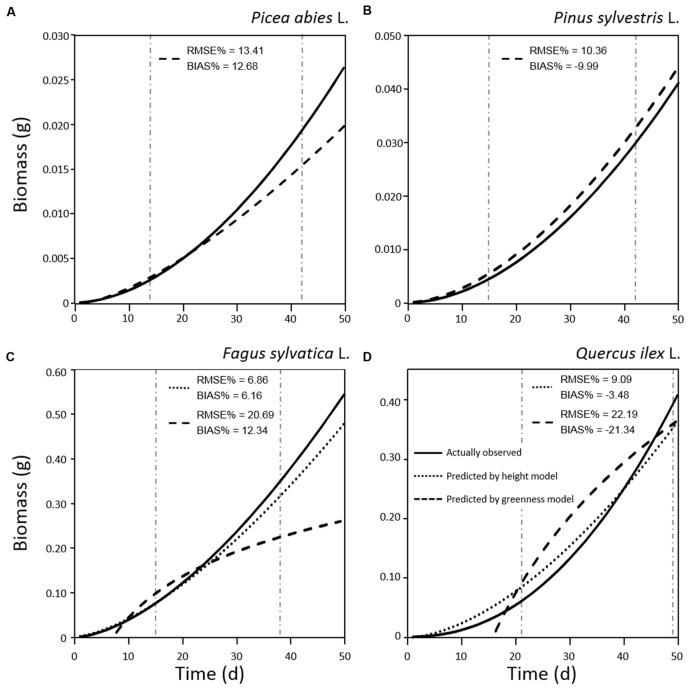
FIGURE 7.
Regression models of biomass growth for seedlings of Picea abies (A), Pinus sylvestris (B), Fagus sylvatica (C), and Quercus ilex (D), calculated by destructive sampling (actually observed; solid line) and by plant height (dotted line) and greenness (dashed line) models. RMSE% and BIAS% values were calculated comparing values predicted by plant height or greenness models with actual observations in the range of measurements (vertical dot-dashed lines).

