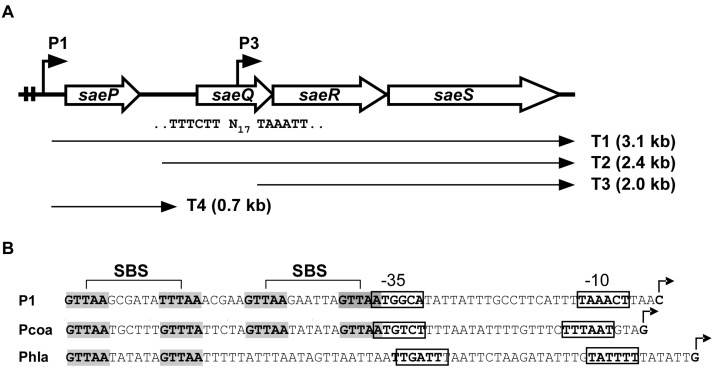
Figure 1.
The sae operon. (A) Organization of the sae operon. Two angled arrows represent the P1 and P3 promoters, respectively. Two vertical lines in the P1 promoter region indicate the SaeR binding sequences (SBSs). The nucleotide sequence of the P3 promoter is shown under saeQ, where N17 = 17 nucleotides. Four transcripts (T1–T4) are indicated by arrows; (B) DNA sequences of select sae target promoters. The SBSs are shown in gray. Transcription start sites are indicated by angled arrows. The promoter sequences are shown in boxes. Pcoa, the promoter of coagulase (coa); Phla, the promoter of α-hemolysin (hla).

