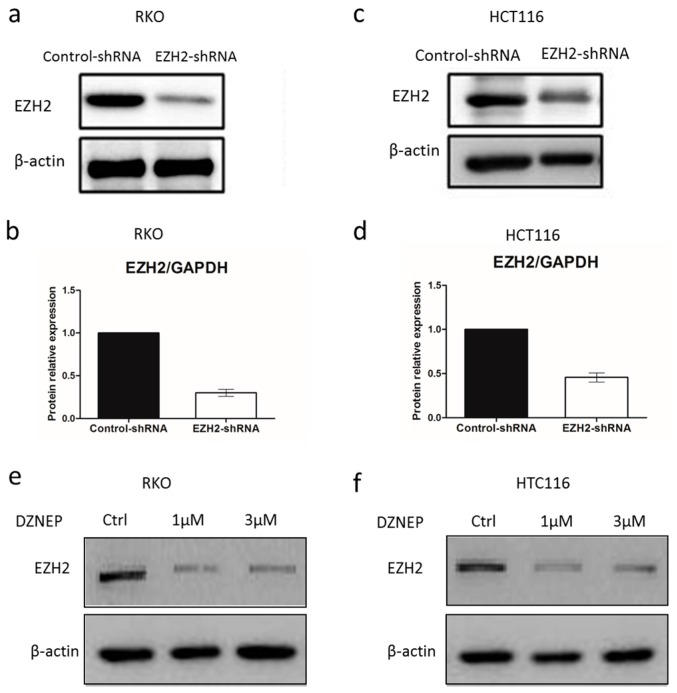
Figure 3.
The knockdown efficiency of EZH2. The protein and mRNA levels of EZH2 expression in control-shRNA and EZH2-shRNA in RKO and HCT116 cells were tested by western blot (a,c) and QRT-PCR (b,d). Error bars represent SD (n = 3). HCT116 cells were treated with DZNep (1 or 3 μmol/L) for 72 h. EZH2 protein expression was analyzed by Western blot in RKO (e) and HCT116 (f) cells.

