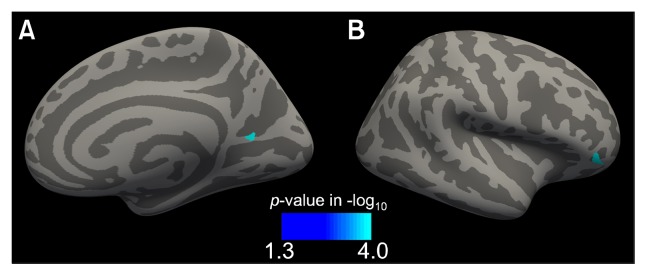
Fig. 2.
Statistical maps of a cluster that displayed reduced regional homogeneity in the pairwise comparison. Clusters were found at the right (A) precuneus and (B) pars orbitalis surface. The surface overlay displays the family-wise corrected p-values calculated from 10,000 simulations of Monte-Carlo Z statistics.

