
Fig.1.
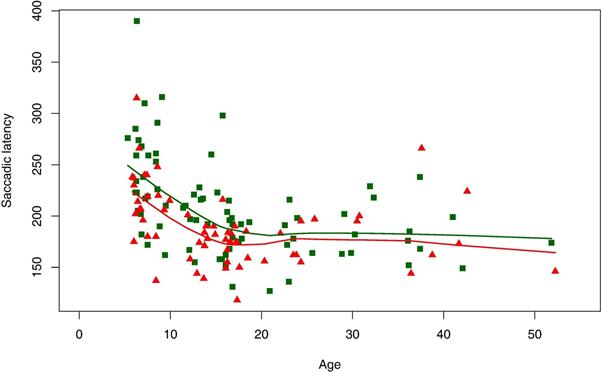
Saccade latency measures for AUT group (green squares) and control group (red triangles), and locally weighted scatterplot smoothing curves for AUT group (green line) and control group (red line).
Official websites use .gov
A
.gov website belongs to an official
government organization in the United States.
Secure .gov websites use HTTPS
A lock (
) or https:// means you've safely
connected to the .gov website. Share sensitive
information only on official, secure websites.
Saccade latency measures for AUT group (green squares) and control group (red triangles), and locally weighted scatterplot smoothing curves for AUT group (green line) and control group (red line).