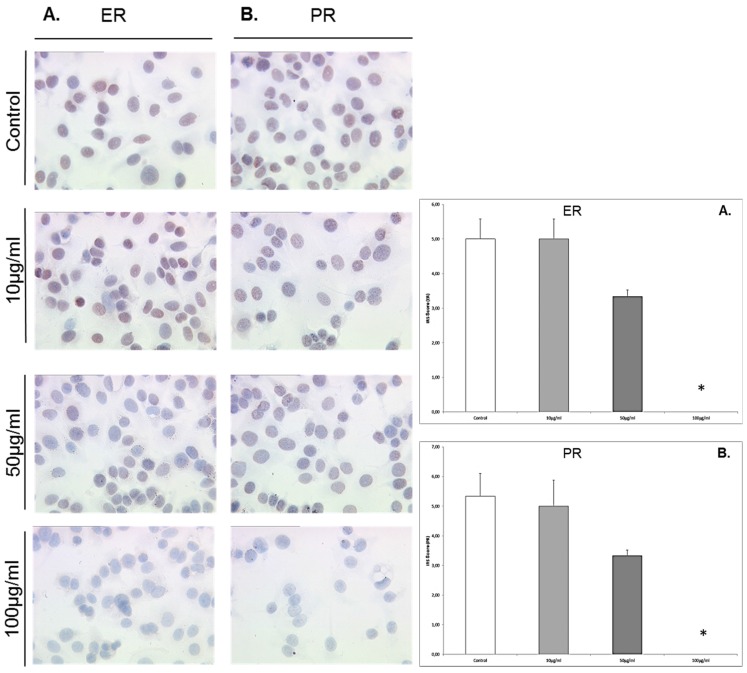
Figure 6.
Representative microphotographs of MCF7 cells grown in the absence or presence of enterodiol at concentrations of 10 μg/mL, 50 μg/mL, and 100 μg/mL), after immuno-detection of ER-α (A) and PR (B) ; and presentation of the immunocytochemistry results by the semi-quantitative immunoreactivity score (IRS). Significantly observations are highlighted with an asterisk.

