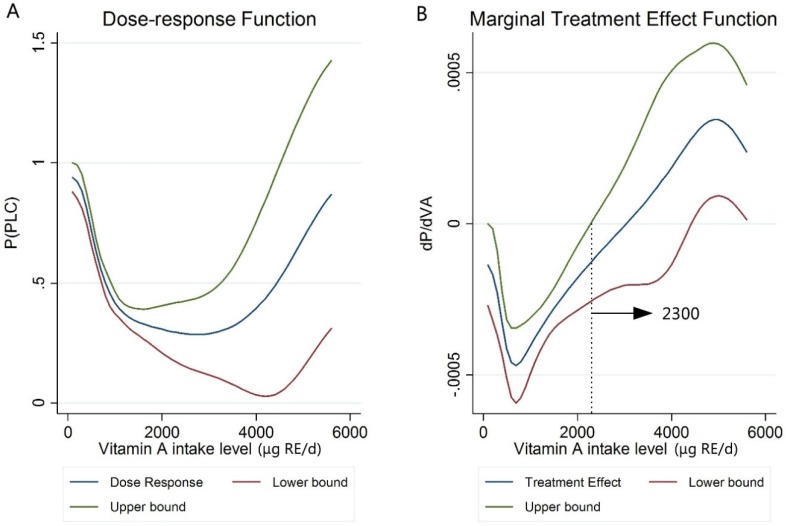
Figure 1.
Dose–response function and marginal treatment effect function (dP/dVA) of expected probability of PLC and vitamin A intake (in μg retinol equivalent (RE)/day, 1 μg RE = 3.3 IU) using the generalized propensity score (GPS) approach, point estimate, and 95% CI. (A) The relationship between VA intake and the expected probability of PLC; (B) marginal treatment effect function of VA intake and the expected probability of PLC association. Lower and upper bound: 95% confidence interval; P (PLC) = the expected probability of PLC; dP/dVA = the derivating dose–response function.

