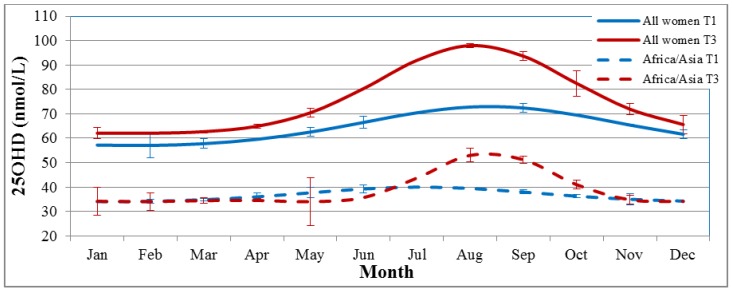
Figure 1.
The four cosine functions fitted to the 25(OH)D concentrations at T1 and T3, for the whole cohort and the subgroup born in Africa and Asia. Error bars show the standard deviations of the predicted vs. crude mean 25(OH)D per month. 25(OH)D, 25-hydroxyvitamin D; T1, first trimester; T3, third trimester.

