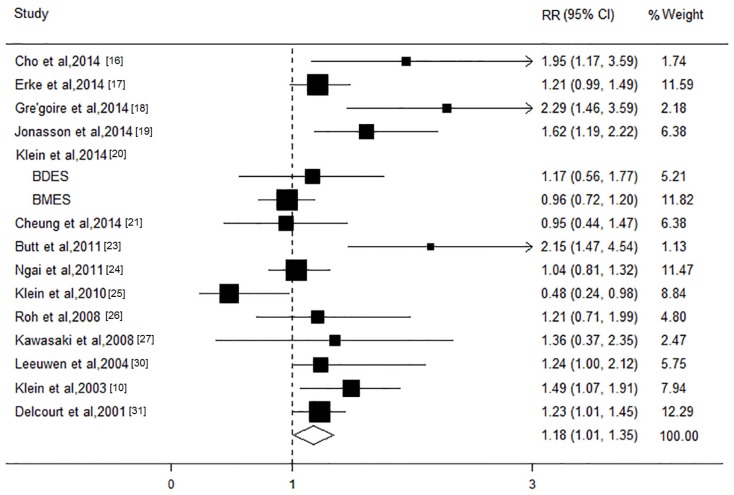
Figure 2.
Forest plot on the associations between the high-density lipoprotein level and age-related macular degeneration. The boxes and lines indicate the relative risks (RRs) and their 95% confidence intervals (CIs) on a log scale for each study. The pooled relative risk is represented by a diamond. The size of the black squares indicates the relative weight of each estimate. BDES, the Beaver Dam Eye Study; BMES, the Blue Mountains Eye Study.

