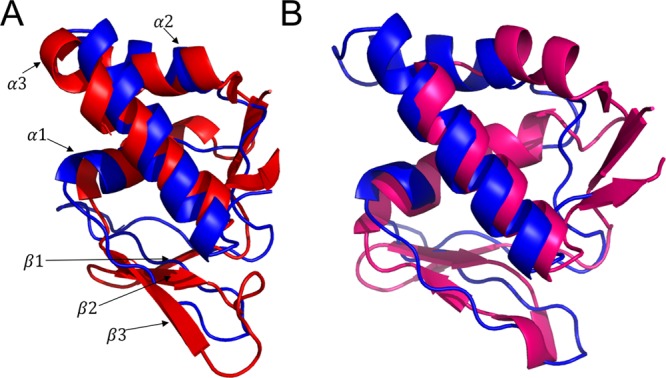
Figure 3.

Comparison of LarB1 homology model to NisB and MccB leader peptide binding domain. (A) Homology model of LarB1 (blue) overlaid with NisB residues 139–225 (red). (B) Homology model of LarB1 (blue) overlaid with MccB chain B residues 1–81 (pink). NisB structures drawn from PDB file 4WD9. MccB drawn from PDB file 3H9G.
