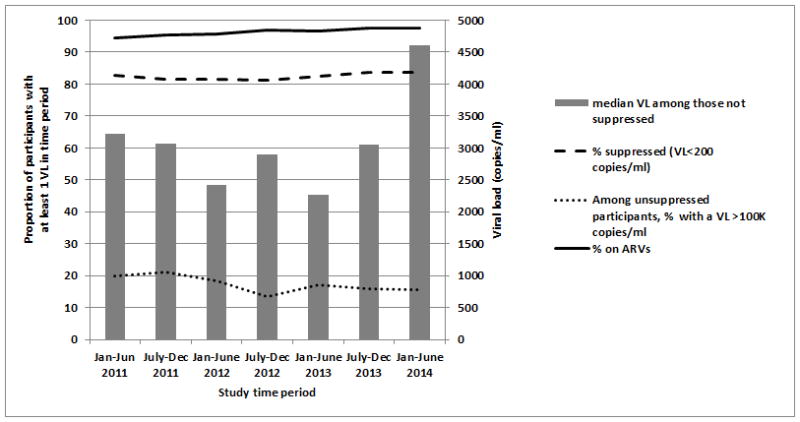
Figure 1. Trends in Antiretroviral Use and Viral Suppression among DC Cohort participants, January 2011–June 2014.

This figure presents the proportion of participants who were on antiretroviral (ARV) treatment, had at least one VL test result, and were suppressed (VL<200 copies/ml) at each 6-month interval between January 2011 and June 2014. Among those who were not suppressed, the median VL and percentage of participants who had a VL over 100,000 copies/ml are also shown.
