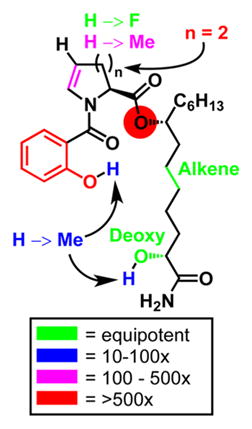
Table 1.
IC50 Values of Promysalin Diastereomers and Active Compounds in μM (Compounds with IC50 > 250 μM Are Not Shown)a

| PA01 | PA14 | |
|---|---|---|
| 1 (2R,8R) | 4.1 | 0.067 |
| 1b (2R,8S) | 46 | 6.6 |
| 1c (2S,8S) | 90 | 22 |
| 1d (2S,8R) | 33 | 4.3 |
| 6 | 111 | 28 |
| 9 | 7.7 | 0.019 |
| 10 | 32 | 12 |
| 11 | 57 | 6.7 |
| 18 | 5.8 | 0.035 |
| 19 | 38 | 11 |
| 21 | 8.3 | 0.067 |
Values are averages of three independent experiments (see SI for graphs and experimental details). A color-coded SAR is provided depicting the fold decrease in activity (right).
