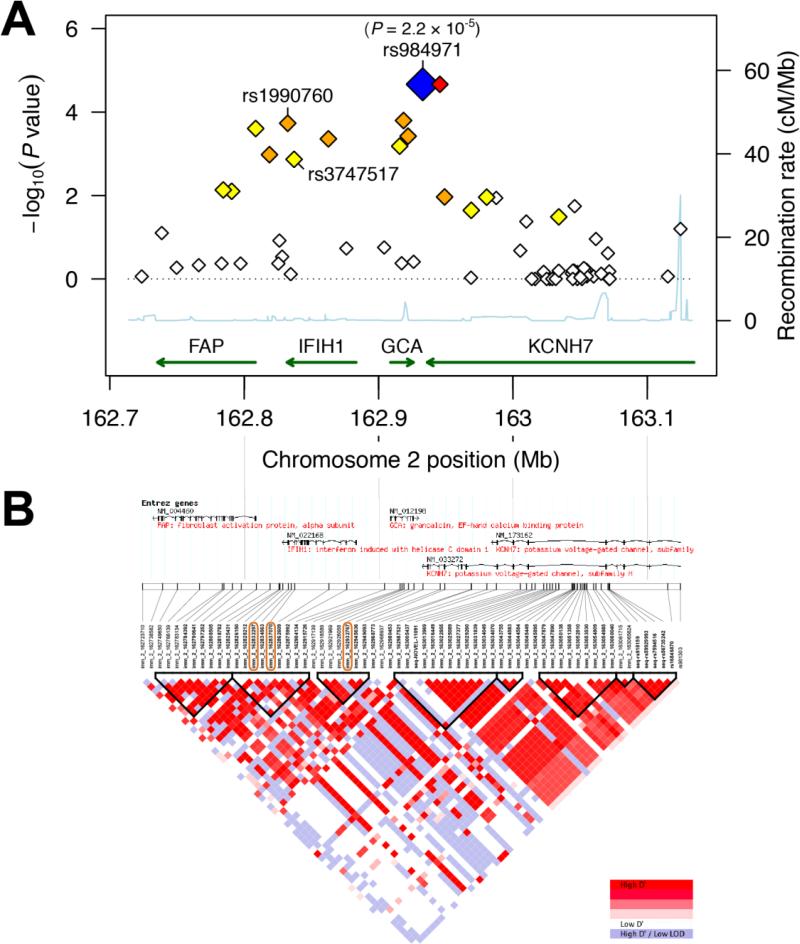
Figure 2. (A) Regional association plot and (B) linkage disequilibrium (LD) map for the FAP-IFIH1-GCA-KCNH7 LD region on chromosome 2.
(A) 64 SNPs with MAF > 5% in 403 Caucasian individuals of the candidemia cohort (cases and controls together) were assessed for genotypic association with candidemia. The resulting - log10(genotypic P values) (left y-axis) are plotted as a function of genomic coordinates (hg18, x-axis). The blue diamond highlights the most significant SNP with its P value (rs984971). rs1990760 and rs3747517 are the only two significant missense SNPs; both are in the coding region of IFIH1. Recombination rates, estimated from the CEU, YRI and JPT+CHB HapMap populations (HapMap 2, Release 22) [56], are plotted to reflect the local LD structure (right y-axis, cyan line). SNPs are colored according to the degree of LD with the most significant SNP, rs984971 (R-squared, calculated across the controls in the candidemia cohort; from strong to weak LD - red: r2≥0.8; orange: 0.5≤r2<0.8; yellow: 0.2≤ r2<0.5; white: r2<0.2). Genes with their direction of transcription are shown at the bottom; KCNH7 is only partly in this region. (B) LD patterns across the 405 kb FAP-IFIH1-GCA-KCNH7 LD region are calculated based on genotypes of control individuals in the candidemia cohort, measured using the Immunochip SNP array. The intersections of the diagonals between pairs of SNPs are colored according to the degree of LD, which is calculated as D' and LOD: SNPs with D' values between 0 and 1 and with LOD ≥ 2 are colored from white to red. Haplotype blocks (triangles with bold black borders) are regions where at least 95% of SNPs are in strong LD, defined by high D' values [57]. Chromosome 2 coordinates (hg18) and Entrez genes are shown at the top. Orange boxes around SNP identifiers indicate the top SNP and two IFIH1 m SNPs significantly associated with susceptibility to candidemia (see Table 2). The corresponding R-squared LD map for the candidemia cohort is depicted in Figure S1D. See Figures S1A-C for R-squared and D’/LOD LD maps calculated based on the HapMap CEU population.

