
Figure 2.
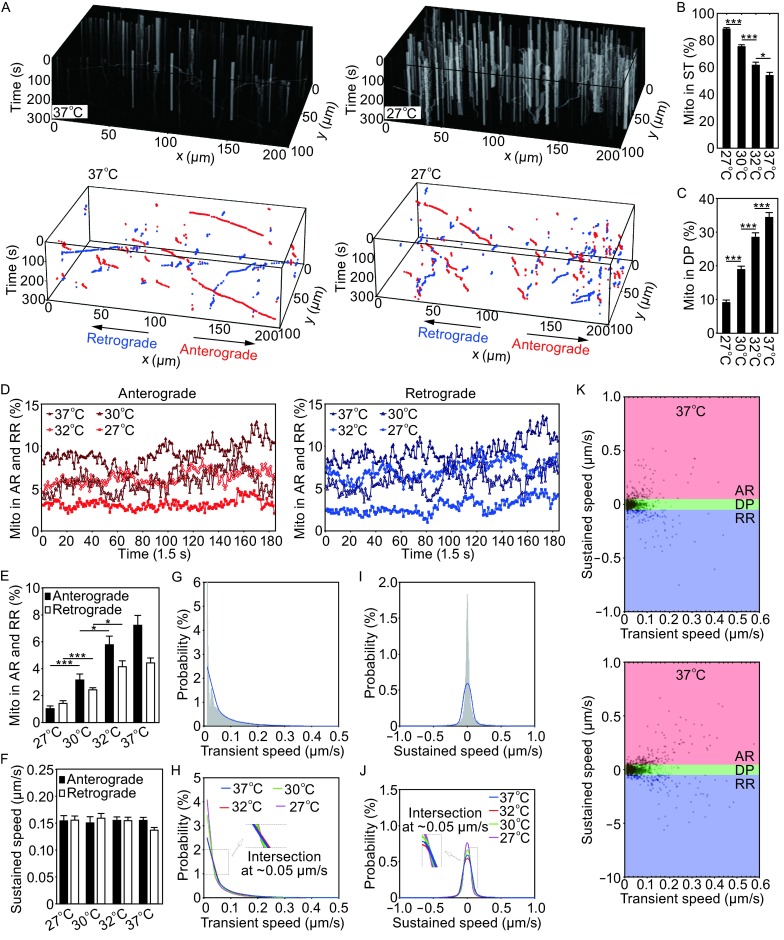
Temperature changes significantly affect axonal mitochondrial movement. (A) 3-D kymographs (top panels) and trajectories generated by MT (bottom panels). A 3-D kymograph was generated by projecting each frame [a 3-D (xyz) image] to a 2-D (xy) image using the maximum method with the xy-t data visualized in the 3-D kymograph. To increase the clarity of the diagram, data collected at two temperatures (37°C and 27°C) are included. In addition, only trajectories of mitochondria in AR or RR states are shown in red and blue colors respectively, without those in the DP state. See Figure S1 for complete set of data for 32°C and 30°C, which includes the DP state. (B) The percentage of mitochondria in stationary state increased as temperature went down from 37°C to 27°C. (C) The proportion of mitochondria in dynamic pause state decreased as temperature was reduced. (D) The proportion of mitochondria in different running states over time. Mitochondrial movement is illustrated by red (anterograde) and blue traces (retrograde). (E and F) Respectively, the proportion of mitochondria running in either directions (AR or RR) and the sustained speed, which can be considered equivalent to the short-term average speed. (G) Histogram of the probability distribution of transient component of speed and its corresponding regression (blue line). (H) Comparison of transient speed distribution among different temperature groups, Curves were averages of twelve image sequences. All curves intersected at ~0.05 μm/s. (I) Histogram of the probability distribution of sustained component of speed and its corresponding regression (blue line). (J) Comparison of sustained speed distribution among different temperature groups. (K) A 2-D parameter space created by calculating sustained speed and its transient speed variance. The ST state was marked in small brown color area near the origin of coordinates zero. At least 60 axonal bundles (12 image series, 5 axonal bundles per image series) from at least 4 independent microfluidic chambers were imaged for each group. At least 1000 mitochondria were identified and quantified for each group. Data represent at least 3 independent experiments [one-way ANOVA, (*P < 0.05; **P < 0.01; ***P < 0.001)]