Figure 1.
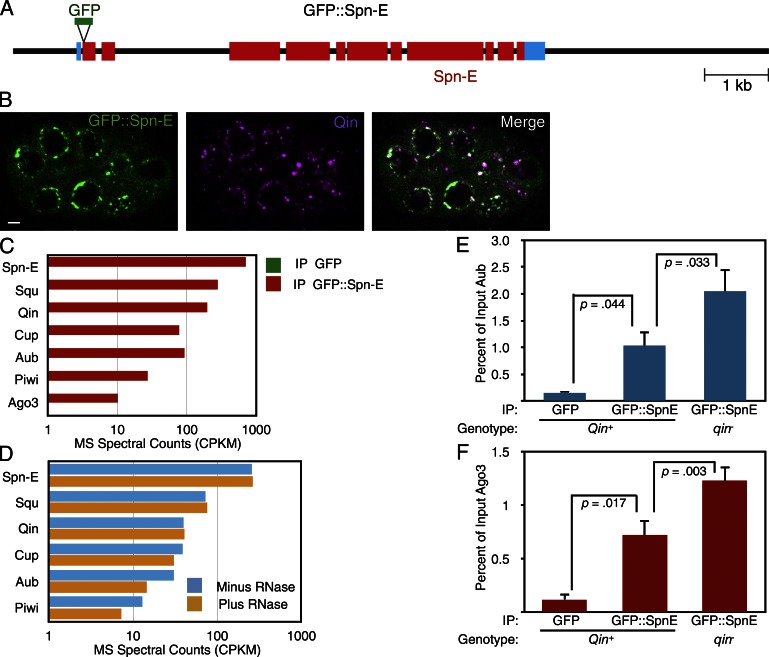
Spn-E associates with piRNA pathway proteins in the Drosophila germline. (A) A schematic of the GFP::Spn-E transgene. The black line shows 5′ and 3′ flanking regions and introns within the transcription unit. Blue boxes show the 5′ and 3′ UTRs. Red boxes show Spn-E coding regions, and the position of the GFP insertion is also shown. (B) Localization of GFP::Spn-E and Qin proteins in a stage 4 egg chamber. The chamber is composed of 16 interconnected germ cells, some of which are visible in this plane of focus. Both proteins are strongly enriched in perinuclear foci called nuage granules. The proteins are depleted in the nuclei, and GFP::Spn-E in particular is also detected throughout the cytoplasm. Bar, 5 µm. (C) Normalized spectral counts from mass spectrometry of proteins that coimmunoprecipitated with either GFP::Spn-E or GFP alone (signal is below detection in the graph). Although the results of only one experiment are shown, similar results were obtained in two other experiments. (D) Normalized spectral counts from mass spectrometry of proteins that coimmunoprecipitated with GFP::Spn-E. Before mass spectrometry analysis, half of the immunoprecipitate was treated with an RNase cocktail and the other half was mock treated, and dissociated proteins were washed away before mass spectrometry analysis of the precipitate. (E and F) Anti-GFP immunoprecipitation of proteins from wild-type and qin mutant ovary extracts and Western quantitation of Aub (E) and Ago3 (F) proteins that coimmunoprecipitated. As indicated, some ovaries expressed GFP alone and some ovaries expressed GFP::Spn-E. n = 3 replicate experiments. Shown are means with error bars representing SEM. P-values are the results of paired and unpaired two-tailed t tests. IP, immunoprecipitate. MS, mass spectrometry. CPKM, counts per kilodalton per million.

