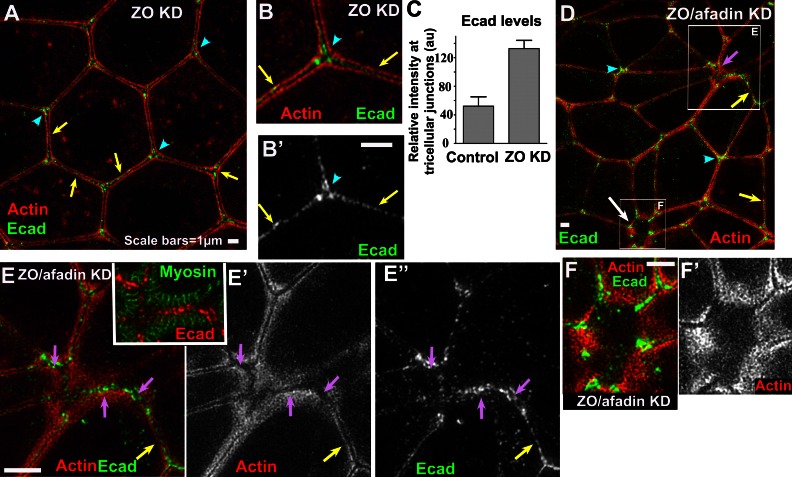
Figure 7.
ZO KD leads to Ecad enrichment at tricellular junctions. (A, B, and D–F) SIM projections of apical 2-µm sections. (A–C) ZO KD. Ecad puncta are scattered along BCJs (arrows) and enriched at TCJs, where they fill spaces between actin cables (C, arrowheads). Error bars are SDs of >30 tricellular contacts (n = 3). (D–F) ZO/afadin KD. Ecad puncta remain scattered along BCJs (yellow arrows) and enriched at TCJs (arrowheads), but at MCJs (magenta arrows) where actin becomes diffuse and myosin structures expand laterally, Ecad puncta fill spaces in these networks (E). At larger scale, ZA discontinuities (D [white arrow] and F) and Ecad surrounds the region. Bars, 1 µm.

