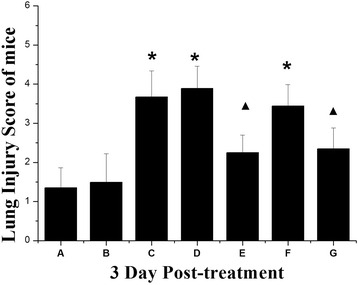
Fig. 7.

Lung injury score of mice in different experimental groups 3 days post-treatment. Data are represented as mean ± standard error of the mean; n =6 per group. *Response that is significantly different from the control (p < 0.05). ▲Response that is significantly different from the H9N2 infected mice (p < 0.05). See text for definition of groups A–G
