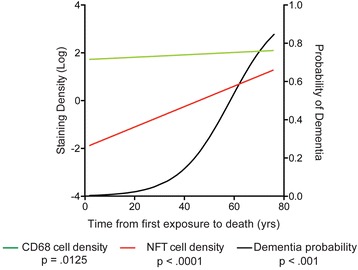
Fig. 3.

A model of the progression of neuroinflammation, ptau pathology, and probability of developing dementia in CTE. The regression lines for CD68 cell density, NFT density, and the probability of developing dementia were plotted within a single graph and correlated with time from first exposure to death (years). Binary logistic regression beta values were used to generate the probability curve for dementia
