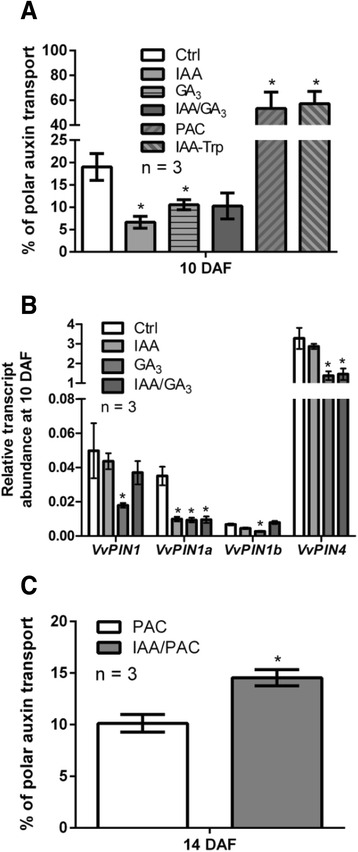
Fig. 7.

Effect of IAA and GA on polar auxin transport and VvPINs expression. Percentage of polar auxin transport after a 6-h transport period (a) and relative transcript abundance of VvPIN1, VvPIN1a, VvPIN1b and VvPIN4 (b) in response to 1 μM IAA, 30 μM GA3, 1 μM IAA/30 μM GA3, 20 μM PAC and 1 μM IAA-Trp treatments at 10 DAF. Treatments were performed at 7 DAF and evaluation was done 3 DPT. Percentage of polar auxin transport after a 4-h transport period (c) in response to 20 μM PAC and 1 μM IAA/20 μM PAC treatments at 14 DAF. Treatments were performed at 12 DAF and evaluation was done 2 DPT. For (a) and (b), asterisk indicates that auxin transport or relative transcript abundance in treated fruitlets is significantly different from the corresponding value in control (Ctrl) berries (p < 0.05). For (c), asterisk indicates that polar auxin transport in IAA/PAC-treated berries is significantly different from the corresponding value in PAC-treated berries (p < 0.05). Error bars represent SE of three replicates
