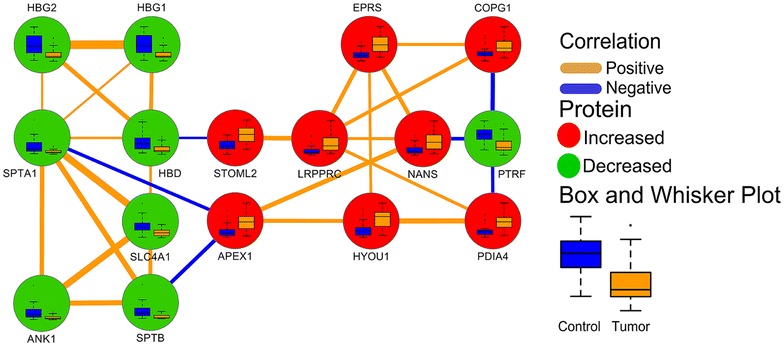
Fig. 1.

Gaussian graphical model empirical network for O-PLS-DA selected top 10% discriminants between normal and tumor tissues. Edge color and width denote the direction and magnitude of partial correlations (pFDR ≤ 0.05). Node color displays the direction of the change in tumor relative to non-malignant tissue (green, decrease; red, increase; pFDR ≤ 0.05). Node inset box and whisker plots summarize differences in spectral measurements between tumor and non-malignant tissue
