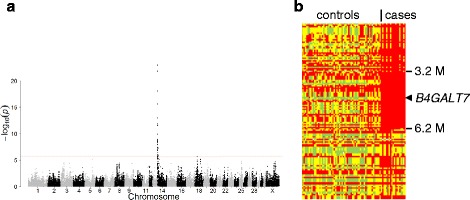
Fig. 2.

Localization of the dwarfism locus in Friesian horses. a Manhattan plot of the genome wide association study. The DNA of 19 dwarfs and 65 controls of the Friesian horse breed was typed with the Illumina EquineSNP50 array. The allele frequency differences between the groups were assessed with GenABEL software and plotted as the –log10p value from Chi-square tests. The red line indicates the Bonferroni corrected significance level. b Homozygosity mapping. Individual genotypes of informative SNPs from the telomeric region (0 - 10 Mb) of ECA14 of cases and controls were extracted from the array data. The results of the telomeric 134 SNPs of the p-arm that passed quality control are shown. Red: homozygous genotype of major allele in the dwarfs; green: homozygous genotype of minor allele; yellow: heterozygous genotype. The region of homozygosity in the dwarfs is bordered by the SNPs BIEC2-239119 and BIEC2-240544
