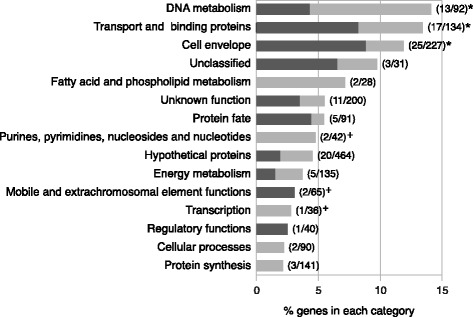
Fig. 3.

TIGR functional roles represented by the 112 strong and moderate candidate phase variable genes. X-axis represents the proportion of putative phase variable genes present in each annotation. Numbers in brackets represent the number of putative phase variable genes over the total number of genes that are associated to a specific function. Genes associated with intragenic and intergenic VNSSRs are represented in dark and light grey, respectively. ‘*’: Enriched functional roles (Bonferroni adjusted p ≤ 0.01). ‘+’: Functional roles not previously described to be associated with SSR-mediated regulation in Nm
