Fig. 1.

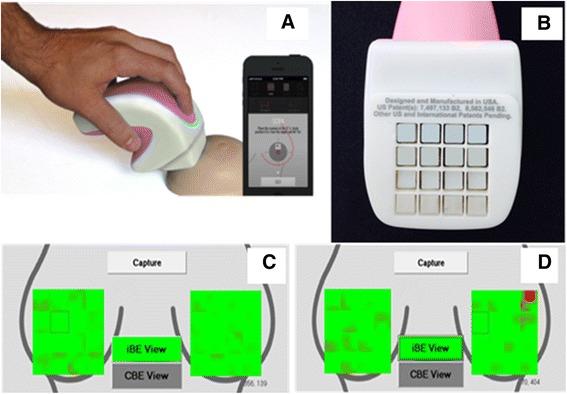
a iBE device and the device in use. b The 4 × 4 array of PEFS. c Data pressure map illustration of normal or negative results. d Data pressure map illustration of abnormal or positive results

a iBE device and the device in use. b The 4 × 4 array of PEFS. c Data pressure map illustration of normal or negative results. d Data pressure map illustration of abnormal or positive results