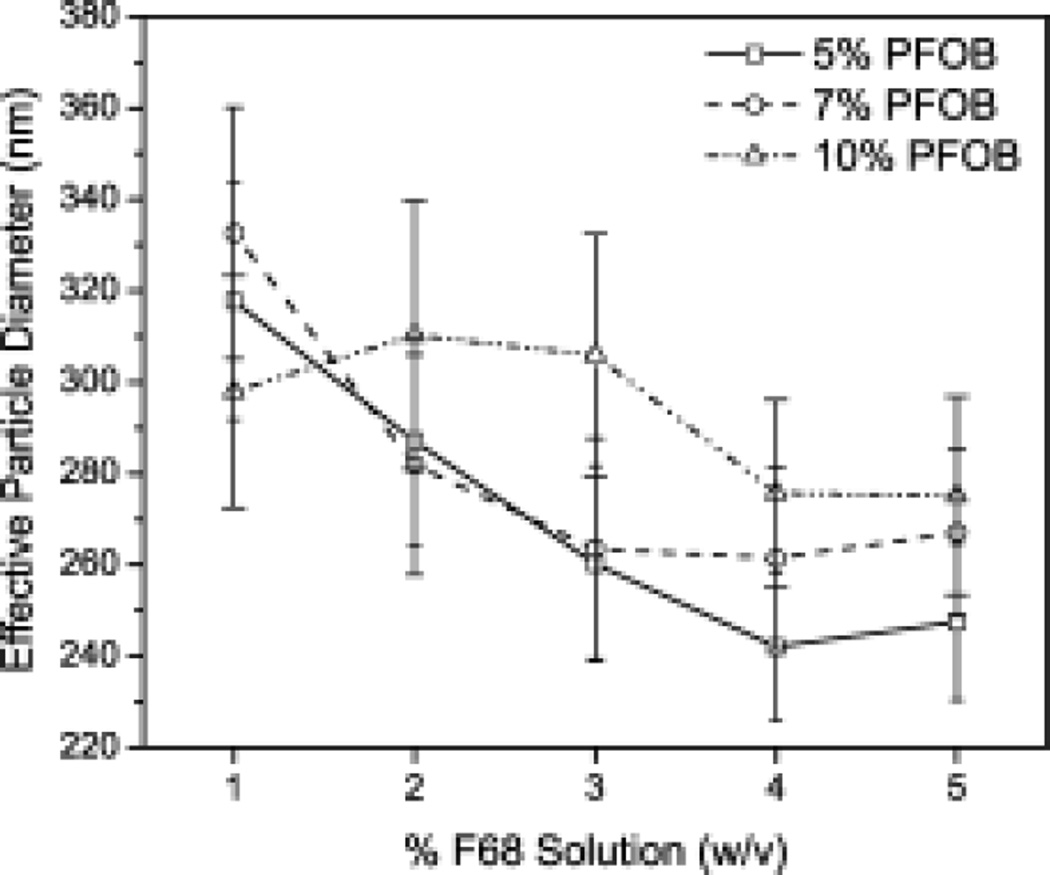
Figure 3.
Average particle size of F68/PFOB emulsions is concentration dependent. Average diameter of F68/PFOB emulsions decrease in increasing F68, but increase with increasing PFOB. 10% PFOB emulsions (∆) show the largest particle size, followed by 7% PFOB (○) and 5% PFOB (□). All % values are in w/v. Error is reported as the standard deviation across all samples taken.
© IF THIS IMAGE HAS BEEN PROVIDED BY OR IS OWNED BY A THIRD PARTY, AS INDICATED IN THE CAPTION LINE, THEN FURTHER PERMISSION MAY BE NEEDED BEFORE ANY FURTHER USE. PLEASE CONTACT WILEY'S PERMISSIONS DEPARTMENT ON PERMISSIONSWILEY.COM OR USE THE RIGHTSLINK SERVICE BY CLICKING ON THE 'REQUEST PERMISSION' LINK ACCOMPANYING THIS ARTICLE. WILEY OR AUTHOR OWNED IMAGES MAY BE USED FOR NON-COMMERCIAL PURPOSES, SUBJECT TO PROPER CITATION OF THE ARTICLE, AUTHOR, AND PUBLISHER.

