
Fig. 3.
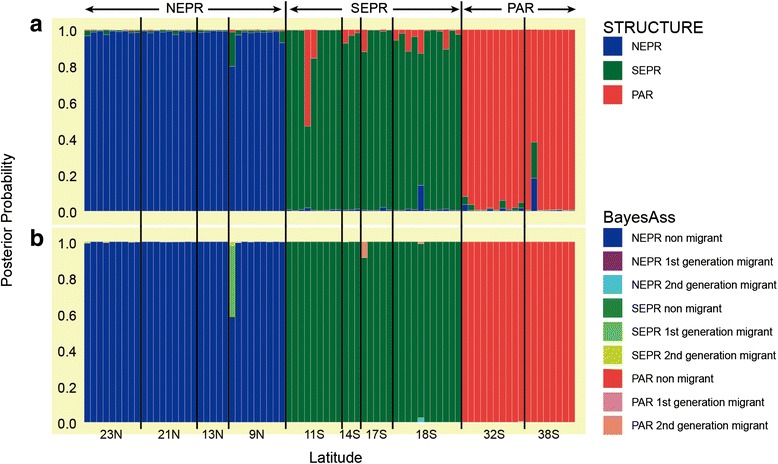
Multi-locus genotypic assignments for nuclear markers. a Structure analysis with K = 3. Vertical bars indicate probability that an individual could be assigned to the NEPR (blue), SEPR (green) and PAR (red) clusters. b BayesAss assignments of migrant ancestries. Color codes indicate posterior probabilities that individuals had native versus immigrant ancestries