
Fig. 4.
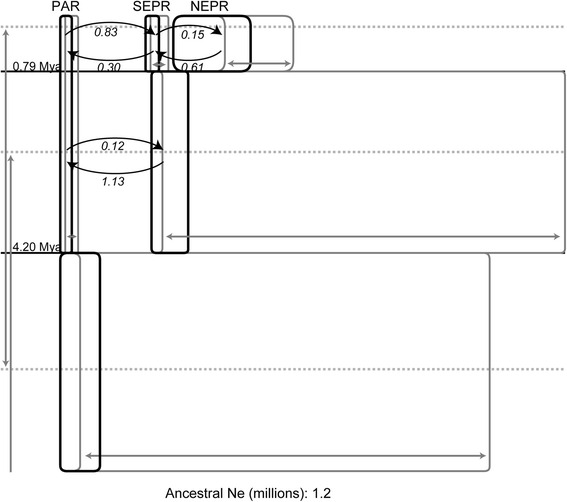
Diverging processes of A. pompejana in the EPR estimated with IMa2. The width of the black boxes represents effective population sizes of each population and each ancestral population, and the width of the gray boxes represents the 95 % highest posterior density (HPD) intervals of them. The horizontal lines represent divergence time between populations. The curved arrows represent migration rate (2 Nm) between populations forward in time. The gray arrows represent 95 % HPD intervals of each demographic parameter. Note that the upper bound of 95 % HPD of the divergence time between PAR and its sister northern group about 4.2 Mya is not shown