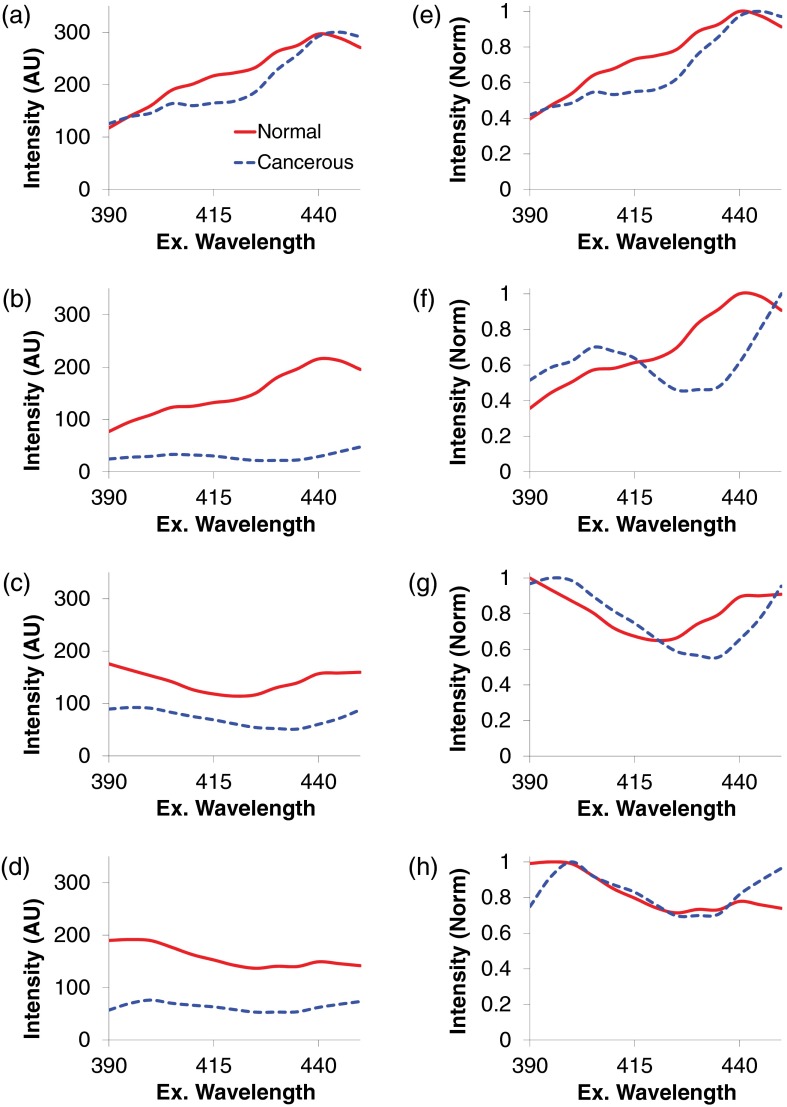
Fig. 5.
Fluorescence excitation scans from 390 to 450 nm of normal mucosa (solid red line) and adenocarcinoma (dashed blue line) from four patients. The total fluorescence excitation intensity (magnitude) of adenocarcinomas is lower than normal mucosa. In addition, adenocarcinomas present several characteristic spectral features, which normalized to a peak value of unity, including a local peak at 400 nm and a local minimum at 430 nm. These differences in spectral signature (fingerprint) offer a potential approach for discriminating cancerous and noncancerous tissues with high accuracy. (a–d) Raw spectra, corrected to NIST-traceable response. (e–h) Spectra normalized to a peak value of unity.

