
FIGURE 1.
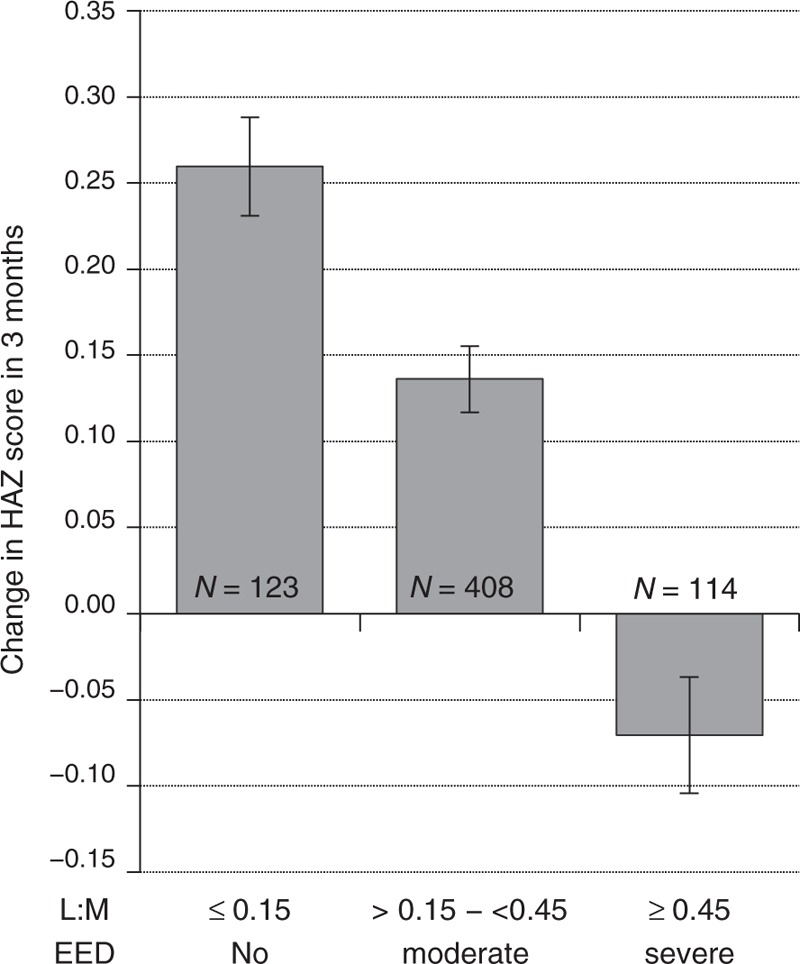
Change in height-for-age z scores in the 3 months after L:M testing. L:M values are categorized as no EED, moderate EED, or severe EED. Data expressed as mean ± SEM. Differences between any of the 3 categories were statistically significant, (P < 0.0001), using one-way ANOVA. ANOVA = analysis of variance; EED = environmental enteric dysfunction; HAZ = height-for-age z score; L:M = lactulose to mannitol; SEM = standard error mean.