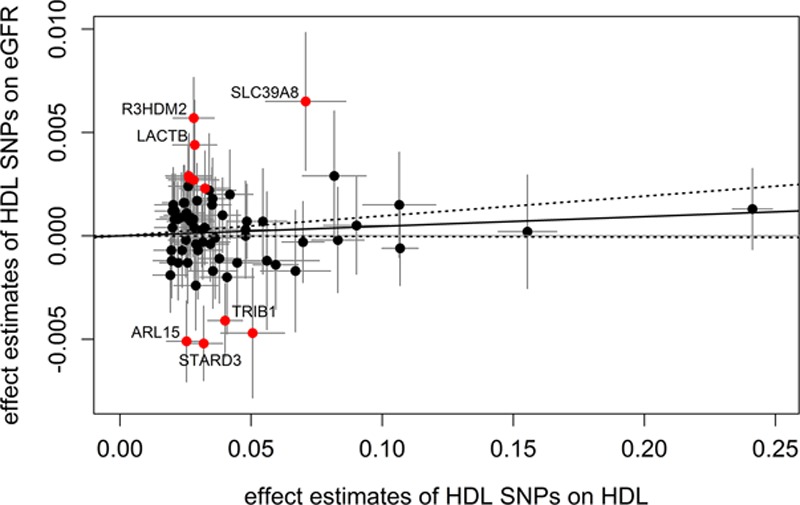
Figure 3.

Scatter plots showing the effect estimates of single-nucleotide polymorphism (SNP)–high-density lipoprotein (HDL) associations (±95% confidence interval [CI]) in SD of HDL cholesterol values on the x axis and SNP–estimated glomerular filtration rate (eGFR) associations (±95% CI) in log-transformed eGFR values on the y axis. SNPs showing effects that are potentially not mediated by HDL cholesterol (according to goodness-of-fit test) are marked in red. For the Mendelian randomization estimate, these SNPs were excluded. The continuous black line represents the Mendelian randomization estimate of HDL on eGFR, the dashed lines the corresponding 95% CI. The 6 SNPs, which were significantly associated in a single SNP analysis with eGFR, are annotated with their gene name.
