Figure 1.
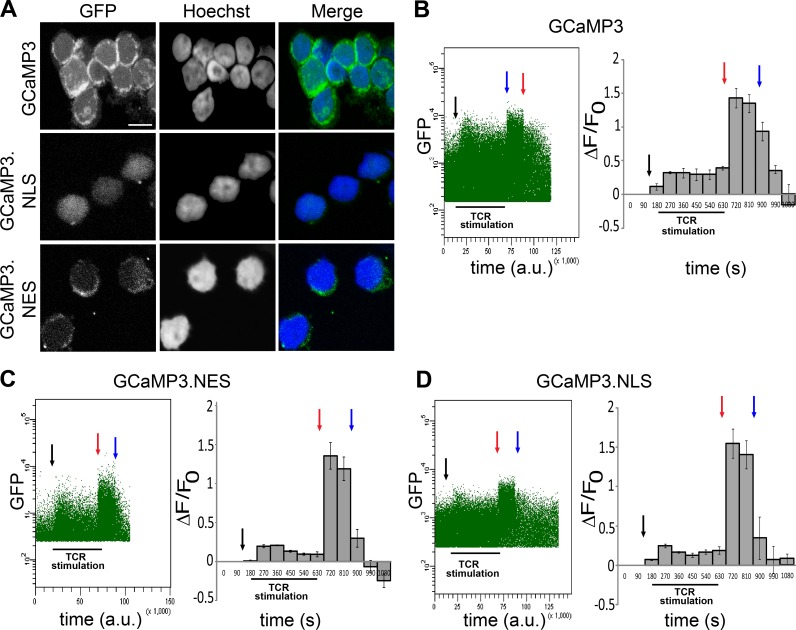
TCR activation induces calcium transients in the cytoplasm and the nucleus in primary human T cells. (A) Confocal images showing the subcellular localization of the genetically encoded calcium indicators GCaMP3 (cytoplasm and nucleus), GCaMP3.NLS (nucleus), and GCaMP3.NES (cytoplasm). Bar, 5 µm. (B–D) Representative experiments showing calcium transients in human T cells transfected with the indicated calcium sensors and stimulated with CD3 antibodies. Anti–mouse IgG (black arrows) was added for antibody cross-linking, and calcium signals were measured for 9 min. Ionomycin (red arrows) and EGTA (blue arrows) were added to obtain the maximum (Fmax) and minimum (Fmin) signal, respectively. Calcium signals were analyzed by monitoring changes in GFP mean fluorescence as a function of time. The dot plots (left) are representative examples of at least four independent experiments (a.u., arbitrary units). Histograms (right) show mean GFP fluorescence (ΔF/F0) from seven (GCaMP3), four (GCaMP3.NLS), and four (GCaMP3.NES) independent experiments. Error bars represent SEM.

