Figure 4.
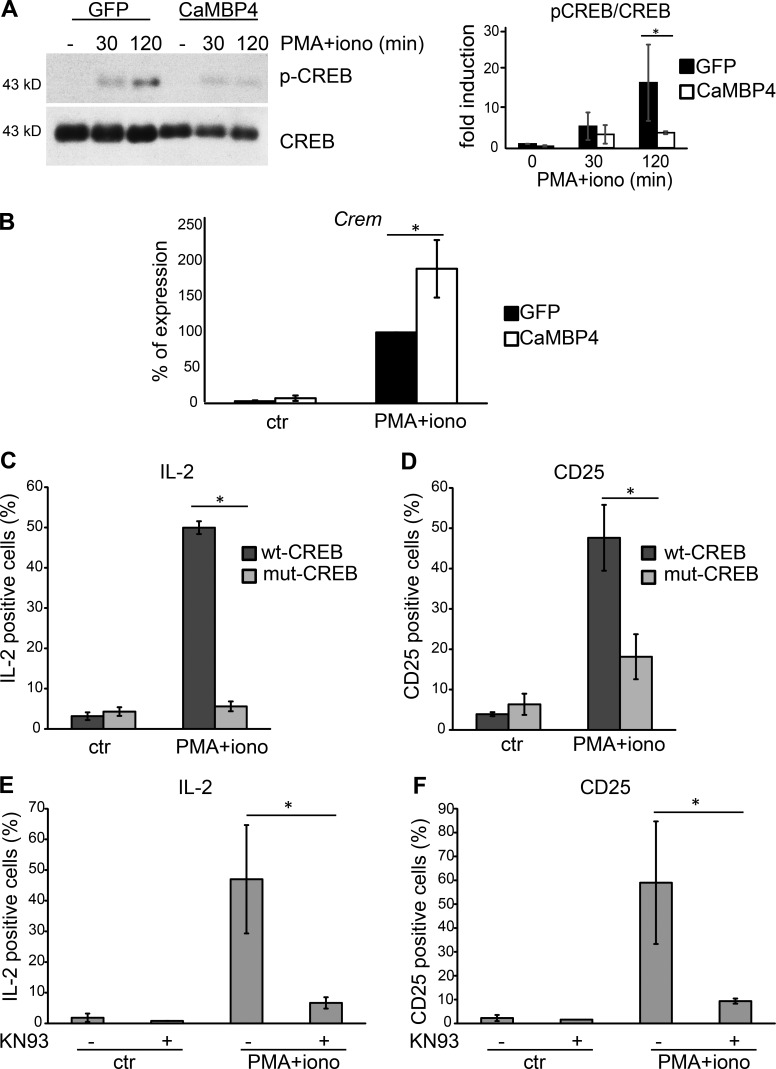
Nuclear calcium signaling differentially regulates CREB activation and CREM expression in primary human T cells. (A, left) Immunoblot analysis of CREB and the serine 133–phosphorylated form of CREB (pCREB) in T cells transfected with expression vectors for CaMBP4.GFP (CaMBP4) or GFP and stimulated with a combination of PMA and ionomycin for 30 or 120 min. A representative example is shown. (right) Quantitative analysis of three experiments; fold induction is relative to the pCREB/CREB ratio in unstimulated GFP-expressing T cells. (B) QRT-PCR analysis of Crem mRNA in T cells transfected with expression vectors for CaMBP4.GFP (CaMBP4) or GFP. Cells were stimulated with a combination of PMA and ionomycin for 6 h or were left unstimulated (ctr). mRNA levels are expressed relative to the mRNA level in GFP-expressing T cells stimulated with a combination of PMA and ionomycin, which was set to 100%. n = 3. Statistically significant differences are indicated with an asterisk (*, P < 0.05). (C and D) FACS analysis of the percentage of IL-2– and CD25-expressing T cells transfected with GFP-tagged expression vectors for either wild-type CREB (wt-CREB) or mutant CREB containing a serine-to-alanine mutation at aa 133 (mut-CREB). Cells were stimulated with a combination of PMA and ionomycin for 6 h or were left unstimulated (ctr). n = 3. Statistically significant differences are indicated with asterisks (*, P < 0.05). (E and F) FACS analysis of the percentage of IL-2– and CD25-expressing T cells. Cells were stimulated with a combination of PMA and ionomycin for 6 h or were left unstimulated (ctr). n = 3. Pretreatment with KN93 was done as indicated. Statistically significant differences are indicated with asterisks (*, P < 0.05). Error bars represent SEM.

